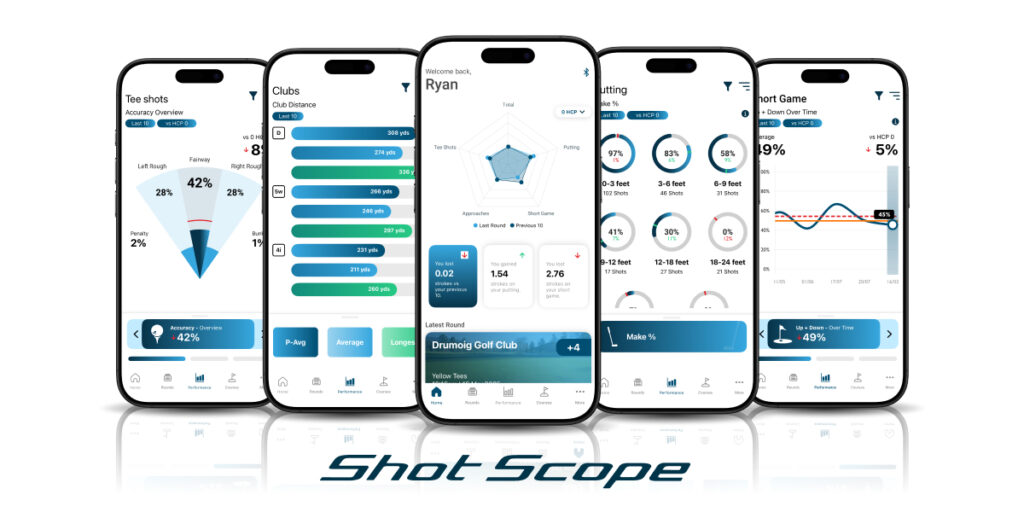
We are updating the performance pages on both the mobile app and web dashboard in line with the recent home page update. Make sure your app is up to date.
The update will roll out in three phases, and they are as follows:
- Aesthetics
- Statistics
- Insights
Phase one will be purely aesthetic and give the performance pages a fresh look like that of the home page. Some examples of updated graphs and charts can be seen below:
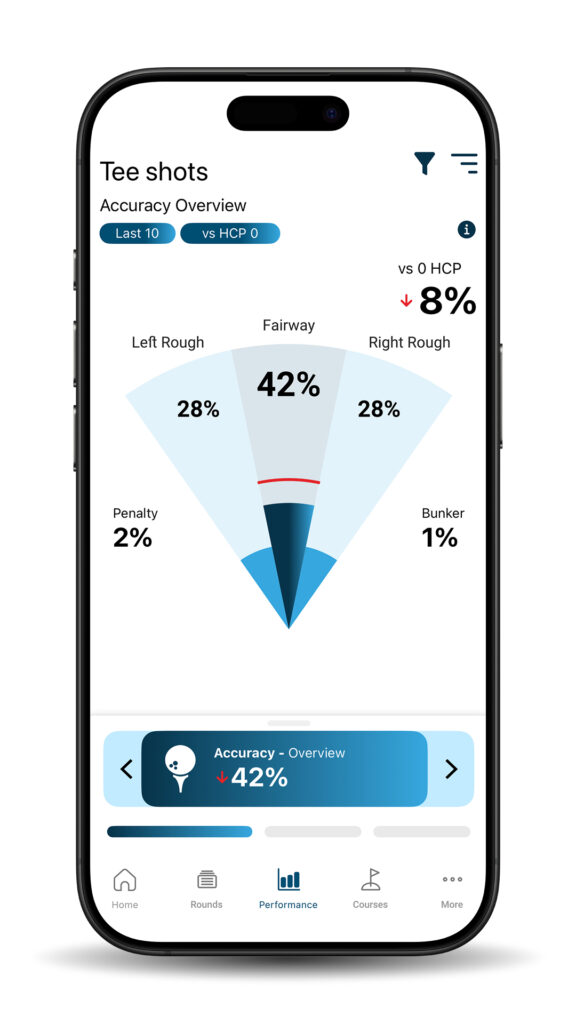
The tee shot dispersion graphic has been simplified. This makes analysing your tendency off the tee quick and easy to understand.
By using the funnel icon in the top right corner, you can filter data by year, last 10 rounds, last 5 rounds, and more. This allows for a specific time period analysis.
Within this menu, you can also choose which handicap benchmark you would like to compare your stats against.
This allows you to compare your data to that of someone at the same level, better, or worse – that is, should you want to.
Handicap benchmarks can be a great tool for goal setting, which ahead of the golfing season, is a great idea!
In the bottom third of the screen, you will see the current stat you are viewing. Additionally, you will see a green or red arrow pointing up or down. The arrow’s direction signifies your performance compared to your chosen handicap benchmark.
Depending on the stat, you will also see some arrow buttons that, when pressed, will navigate through related stats.
For example, within the tee shot accuracy data, there are three different stats. They are indicated by the bars below the stat navigation. The three stats are:
- Accuracy – Overview
- Accuracy – Over Time
- Accuracy – By Club
To navigate back to the main performance page, press the list icon in the top right corner. This is beside the funnel icon.
When using the app, here are some useful pointers to bear in mind:
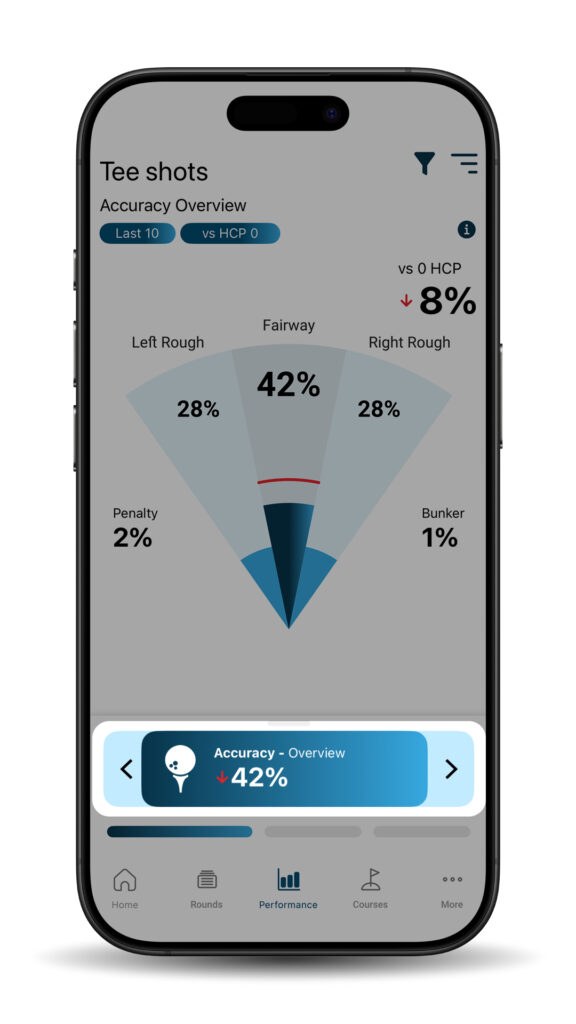
- The data navigation bar in the bottom third of the screen can be swiped up to reveal more statistics or swiped down to hide it. To bring it back, simply drag it back up.
- Graphs that relate to performance over time can be swiped left and right to look back through dates.
- When looking at your scoring breakdown, tap the different segments of the circle graph to interact with the data.
App Versions for this update:
iOS: 3.1.3
Android: 4.4.0
Please note: Depending on your device and region, it may take up to 24hrs for the update to become available on your device.