How do Amateur Golfers compare to the LPGA Tour Professionals?
This article looks at 12 key performance metrics to compare a scratch golfer against LPGA golfers. The data for the scratch golfer is from Shot Scope’s database of over 160 million shots hit by amateur golfers and the data for the LPGA golfers is taken directly from the LPGA website.
This article does not look at individual LPGA players, but looks at the statistics for the golfer who is ranked 1st, 10th, 50th and 100th in each category.
Of the 12 performance metrics analysed, scratch golfers perform better than the 100th ranked LPGA player in 6 areas, and better than the 50th ranked player in only 1 area.
See the breakdown of each performance metric below. It is worth mentioning that the average course length on the LPGA is 6,400 yards and the average course length that scratch golfers play is 6,200 yards.
These 12 performance metrics were chosen as the LPGA has a limited number of statistics about their player’s performance on their website.
| LPGA #1 | LPGA #10 | LPGA #50 | LPGA #100 | Scratch Golfer | |
|---|---|---|---|---|---|
| Average Score | 69.02 | 70.21 | 71.25 | 72.36 | 71.35 |
Playing a slightly shorter course, scratch golfers have an average score of 71.35 which is excellent in its own right. Comparing this against LPGA players and we can see that scratch golfers are a full shot better on average than #100 on the LPGA scoring list. Nearly able to compete against the 50th ranked LPGA players.
Score Breakdown
| LPGA #1 | LPGA #10 | LPGA #50 | LPGA #100 | Scratch Golfer | |
|---|---|---|---|---|---|
| Par 3 Scoring | 2.92 | 2.96 | 3.03 | 3.09 | 3.16 |
| Par 4 Scoring | 3.94 | 3.99 | 4.06 | 4.11 | 4.09 |
| Par 5 Scoring | 4.51 | 4.59 | 4.70 | 4.78 | 4.76 |
Everyone scoring under par on Par 5s which is to be expected of all these players. However it is impressive to see both the #1 and #10 ranked LPGA players scoring under par on both the Par 3s and Par 4s. It is Par 3s that let the scratch golfer down compared to all the LPGA players, but they would rank between #50 and #100 on Par 4s and 5s.
How often is Par broken?
| LPGA #1 | LPGA #10 | LPGA #50 | LPGA #100 | Scratch Golfer | |
|---|---|---|---|---|---|
| % of rounds under par | 80% | 65% | 50% | 37% | 27% |
| Average number of birdies per round | 4.13 | 3.80 | 3.67 | 3.12 | 2.67 |
This is where the key difference between LPGA players and scratch golfers come to light, but also a big difference between the LPGA players themselves. LPGA #1 scores under par more than twice as often as those ranked at #100, however #10 also breaks par nearly twice as often.
This is a surprisingly big jump between the players on the LPGA.
The number of birdies per round plays a huge role in this metric, and again the top players are making 1 more birdie per round on average than #100.
Comparing this against scratch golfers, it is evident that birdies are much less common with LPGA #1 making 1.5 more birdies per round on average.
Driving Accuracy and Distance
| LPGA #1 | LPGA #10 | LPGA #50 | LPGA #100 | Scratch Golfer | |
|---|---|---|---|---|---|
| Driving Accuracy | 85.9% | 79.9% | 74.3% | 68.9% | 49.9% |
| Driving Distance | 291y | 274y | 261y | 254y | 260y |
While the average scratch golfer nearly hits it as far as the LPGA player who is ranked 50th in driving distance, it is accuracy where the biggest gap lies.
LPGA players are known for hitting the ball straight off the tee, but by comparison to a scratch golfer they are way ahead hitting on average 5 more fairways per round (assuming 14 tee shots excluding Par 3s).
Perhaps you are surprised at how far the LPGA golfers actually hit their driver?
How does approach play compare?
| LPGA #1 | LPGA #10 | LPGA #50 | LPGA #100 | Scratch Golfer | |
|---|---|---|---|---|---|
| Greens in Regulation | 78% | 75% | 71% | 68% | 62% |
Again this is another area of the game where all rankings of LPGA players are performing better than an average scratch golfer.
For amateur golfers, approach play and in particular ‘Greens in Regulation’ is the area of the game that provides the most room for improvement. A scratch handicap golfer hits 62% but as handicap increases, the % of greens hit drops dramatically to only 9% for a 25 handicap.
So while the scratch golfer is worse than #100 on LPGA, they are still performing extremely well compared to other amateur golfers.
Putt for Dough?
| LPGA #1 | LPGA #10 | LPGA #50 | LPGA #100 | Scratch Golfer | |
|---|---|---|---|---|---|
| Putts per Round | 28.66 | 29.13 | 30.02 | 30.44 | 29.3 |
| Putts per GIR | 1.714 | 1.758 | 1.805 | 1.838 | 1.820 |
These putting statistics are somewhat restrictive in their analysis. You really need to understand more about the game in order to gain a better understanding.
Putts per round is the only statistic where the scratch golfer outperforms the 50th ranked LPGA player – but there is a reason for this.
For example, the scratch golfer has fewer putts per round on average than both the players ranked #50 and #100 in this category. However the scratch golfer also hits less greens in regulation, so will have more short game shots when the LPGA player would be on the green putting.
The putts per GIR is a slightly better metric to focus on, as it accounts for this difference in number of greens hit per round.
What about bunker play?
| LPGA #1 | LPGA #10 | LPGA #50 | LPGA #100 | Scratch Golfer | |
|---|---|---|---|---|---|
| Sand Save % | 63.08% | 57.41% | 46.97% | 40% | 44.34% |
This is the last metric in the comparison between LPGA players and scratch golfers and it too is an area where the scratch golfer is slightly better compared to the #100 player.
There is quite a difference again in this area amongst LPGA players, with #1 getting up and down from the sand 23% more than #100.
Earnings
| LPGA #1 | LPGA #10 | LPGA #50 | LPGA #100 | Scratch Golfer | |
|---|---|---|---|---|---|
| Official Money | $1,941,977 | $1,013,185 | $318,767 | $105,776 | NA |
The main difference is that the typical scratch golfer generally plays golf for fun, competing against friends or members of their club. Sometimes there is a financial gain at the end of it, but that is dependent on circumstances.
LPGA players on the other hand play golf for a living. If they have a bad round or fail to make the cut, they make nothing.
It is interesting to see that the average scratch golfer performs slightly better than the players ranked #100 for 6 of the 12 of the metrics discussed. However would they perform as well with all the added pressure of trying to make a living from it? You decide.
To summarise…
Looking at the number 1, 10, 50 and 100 in each of these performance metrics allowed for comparisons to be made against a scratch golfer. Overall the scratch golfer outperformed the #100 in 6 areas, but it was close.
There was only one area where the scratch golfer performed better than the #50 player and that was in putts per round, however reasons for that were mentioned in the article.
The statistics were similar with LPGA coming out just ahead, but this would suggest that the scratch golfer or anyone aspiring to become a scratch golfer should take an interest in the LPGA. It provides a platform where amateurs can relate to the game better compared to the PGA tour where the golfers play a totally different style of game.
On the whole, I think it is safe to say the LPGA golfers do hit the ball further, hit the ball straighter, make more birdies, putt better and ultimately score better than your typical scratch golfer.
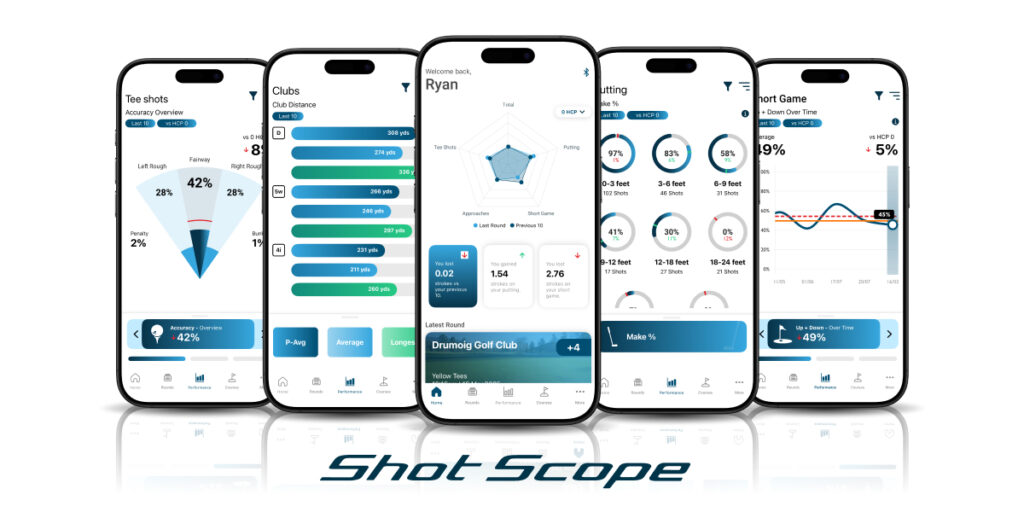
Are you interested in learning these types of statistics about your own game? Shot Scope enables golfers of all abilities to track their game on the course and view 100s of performance statistics like the ones mentioned in this article.
Products such as the V3 GPS watch, H4 GPS handheld and PRO LX+ laser rangefinder all allow you to track your game quickly and easily. Tracking your game is the first step to improving your golf.
