- Game Improvement
- Golfer Case Studies
- Course Strategy
- Shot Scope Data
- Free Golf Improvement Ebooks
Most Popular
10 July 2022
One thing you will never be able avoid when playing the game of golf is the fact that you are going to drop shots. No matter how hard you try there are going to be mistakes made, there are going to be penalty drops, provisional balls, and three putts. To make up for these mistakes, we need as many birdies as we can get on the card.
According to recent studies, when comparing PGA Professionals and your average scratch golfer, the average number of birdies per round on the PGA Tour is 3.63. Shot Scope data tells us that the average scratch player has an average of 2.67 per round. While that may not sound like a lot, one birdie a round for every tournament is four birdies! Four shots in a tournament can be the difference between making and missing a cut or winning and losing. Of course, we cannot force birdies, and it is probably best not to, but there are some things that may be leading to this statistic that we can address.
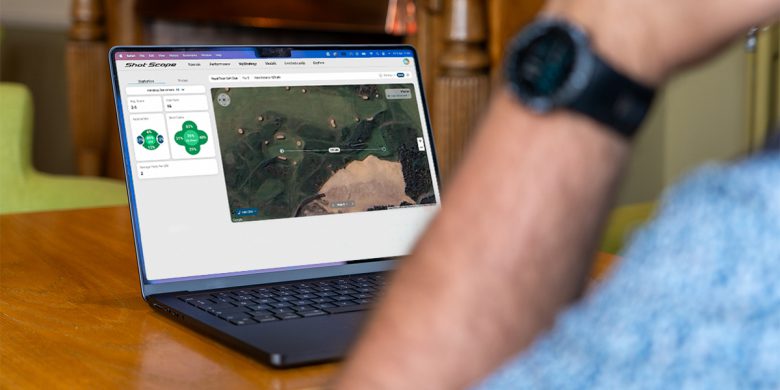
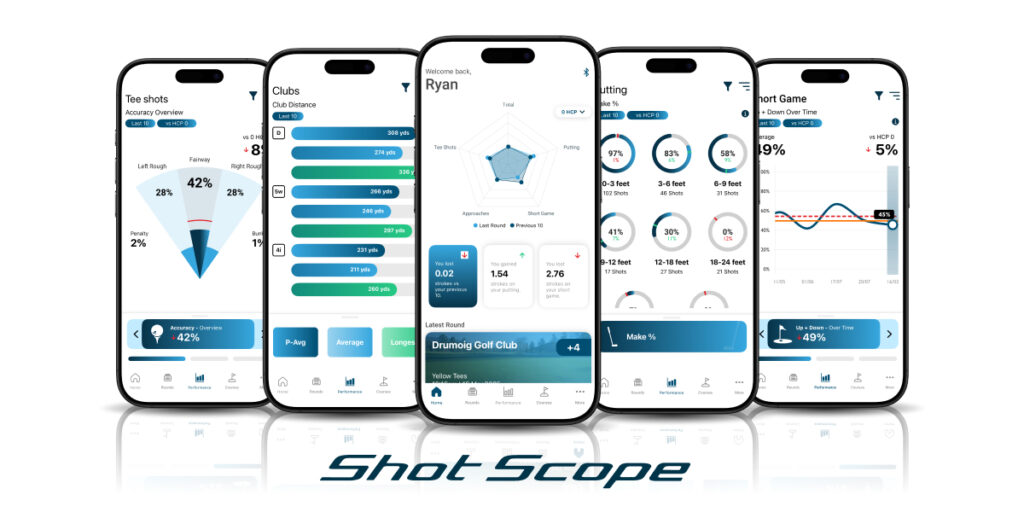
It is hard to say where to start when it comes to making more birdies, but thanks to the Shot Scope tracking technology, you will easily be able to view your average driving distances, fairways, and green in regulations. Having this information at the tip of your fingers means you’ll never be at a loose end with improving your golf.
The statistics highlighed in this article are based on the PGA Tour player ranked #1, #10, #50 in each category, not the #1 ranked player in the world. The Shot Scope 0 handicap statistics are collected from scratch golfers who track their game using Shot Scope. In total, Shot Scope have collect over 180 million shots around the world and have over 100,000 golfers of all abilities.
Looking across the board at these statistics, there are two major factors that seem to be having a negative impact on amateur’s chances at scoring low: average driving distance and average approach proximity. If you really think about it, when you fix the former, you fix the latter.
PGA #1 | PGA #10 | PGA #50 | PGA #100 | PGA #last | PGA Average | Shot Scope 0 Handicap | |
---|---|---|---|---|---|---|---|
Average Score | 69.04 | 69.61 | 70.2 | 70.69 | 72.67 | 70.95 | 71.35 |
Par 3 Scoring | 2.96 | 2.99 | 3.04 | 3.07 | 3.25 | 3.08 | 3.16 |
Par 4 Scoring | 3.95 | 3.97 | 4.01 | 4.03 | 4.16 | 4.05 | 4.09 |
Par 5 Scoring | 4.45 | 4.53 | 4.6 | 4.64 | 4.81 | 4.66 | 4.76 |
Birdies per Round | 4.51 | 4.3 | 3.92 | 3.68 | 2.95 | 3.63 | 2.67 |
Driving Accuracy | 75.25% | 69.6% | 64.78% | 60.8% | 46.86% | 60.69% | 49.9% |
Driving Distance (yards) | 323.7 | 311.6 | 302.8 | 296.6 | 269.2 | 296.2 | 260 |
GIR | 72.58% | 70.16% | 67.89% | 65.76% | 55.46% | 65.14% | 62% |
Approach Proximity | 32.9ft | 34.0ft | 35.9ft | 36.1ft | 42.2ft | 37.1ft | 60.7ft |
Putts per Round | 27.76 | 28.25 | 28.69 | 28.93 | 30.36 | 29.01 | 29.3 |
1 putt % | 45.09% | 42.71% | 40.90% | 39.55% | 33.57% | 39.32% | 37% |
Up and Down % | 67.3% | 64.02% | 61.02% | 59.07% | 46.67% | 57.94% | 56% |
Sand Saves | 65.38% | 60.55% | 54.3% | 50.71% | 29.06% | 50.05% | 44.34% |
2021 Official Money | $7,705,933 | $5,816,565 | $2,291,437 | $1,294,062 | $198,087 | $1,485,055 | N/A |
While we must consider the fact that the courses played in Tour Events are significantly longer than those an amateur might play on a regular basis, it is still a fact that if you start driving the ball further, your approach proximity will be much easier to improve – simply because you are closer to the hole.
As we can see in these statistics, the average driving distance for the Tour players is 296 yards as opposed to the scratch players using Shot Scope at just 260 yards. So instead of hitting a 3 wood into those long par 4s you could be hitting a 6 iron! Even if you improve to hit just one club less into the green, it makes the world of difference, especially if you also spend more time improving your iron play. Improving your approach proximity from the average 60.7ft recorded on Shot Scope to the Tour average of 37.1ft would inevitably lead to more birdies in your round. Less club does equal more accuracy, and therefore shorter putts!
PGA #1 | PGA #10 | PGA #50 | PGA #100 | PGA #last | Shot Scope 0 Handicap | |
---|---|---|---|---|---|---|
Driving Distance (yards) | 323.7 | 311.6 | 302.8 | 296.6 | 269.2 | 260 |
Approach Proximity (ft) | 32.9 | 34.0 | 35.9 | 36.1 | 42.2 | 60.7 |
So, you might ask, ‘how do I improve my driving distance?’ Well, that’s different for everyone, some might need to improve their strength, others might need to work for a more efficient technique. Some might just be swinging it slower than their full potential! Have a chat with your coach or local professional and see if they have any advice. A good thing to check before changing your swing or rhythm are the clubs you have in your bag.
Again, with the help of a professional, have a look through which kind of shafts you have, which kind of head you have, particularly for your driver, and make sure they’re all fitted to you. Not everything works for everyone, and so it is always worth checking that your tools are working just as hard as you are.
Secondly, and it might seem obvious, why not just try swinging it faster? It may not be for everyone, in fact for some it may be more beneficial to slow the tempo down and find a more effective rhythm for a better strike. Although, you may surprise yourself with just how much speed you can generate by trying a little harder. It is very easy to fall into the habit of swinging it too easy, and too slowly, especially if you are always playing at your home course where you are most comfortable. What’s more, we all have that fear that if we try and swing it that little bit faster the trees lining the fairway come much more into play, but in the long run those extra 10 or 15 yards really do pay off as we can see in the statistics.
If we take a look at the final numbers in the chart, it is actually proven that while pros do hit it further, even the tour average, they are also significantly more accurate with their driver.
PGA #1 | PGA #10 | PGA #50 | PGA #100 | PGA #last | Shot Scope 0 Handicap | |
---|---|---|---|---|---|---|
Driving Accuracy | 75.25% | 69.6% | 64.78% | 60.8% | 46.86% | 49.9% |
To be specific, even to be in the top 100 of tour players, there is a considerable 10% difference when comparing them to the average scratch player. That difference increases by a further 10% to a 70% accuracy to reach the top 10 category on Tour. This really is a game-changing figure to consider if you want to see improvement on your scorecard! If you are standing over your driver and there is a 50/50 chance you are going to miss the fairway, that means there is a 50/50 chance you are then going to miss the green. And how many birdies do you make if you miss the green in regulation? Well, enough said.
To keep it simple, birdies may be achieved at the green, but they all start at the tee. Be aggressive, don’t underestimate the power of distance, and let the birdies come to you!
Looking to improve any of the areas mentioned in this article?
Shot Scope features a number of free golf improvement eBooks that can be implemented in tandem with tracking products like our award-winning V3 GPS watch – allowing the user to monitor and analyse their progress just like the Pros!
Did you know that 84% of missed putts over five feet finish short? Or, that your typical drive is nearly 30 yards shorter than your Sunday best drive? These are just two intriguing statistics thrown up by Shot Scope’s performance tracking data platform. Download our free guides for golfers now!
FREE e-books to lower your score