The final edition of our Law of Averages series, the scratch golfer – what does their game look like?
Previously, we have looked at 5hcp, 10hcp, 15hcp, 20hcp, and the 25hcp, we have really covered the bases.
As with all our other handicap brackets, we will look at some top-level statistics to give insight into the various aspects that make up the 1% of amateurs who call themselves scratch golfers
Here are the stats of a typical 0hcp golfer:
| Avg. Par 3 Score | Avg. Par 4 Score | Avg. Par 5 Score | FIR% | GIR% | Up and Down % | Three Putt % | Make % from 0-6ft |
| 3.2 | 4.2 | 4.8 | 50% | 59% | 54% | 3% | 93% |
The immediate stat that should jump out at you from the ones above is the Par 5 scoring average, for the first time this series, we see an average score lower than the par.
Why might that be I hear you ask? Well, it is a combination of things and as we have mentioned in other editions of the series, length is a large contributing factor.
With the driver in the hand, scratch players have a performance average distance of 285y.
Performance average, or P-Avg., is Shot Scope’s metric that gives golfers precise club distances by removing 10% of extreme outliers, both good and bad, to give a distance players can typically expect to hit their club.
Scratch players hit their driver typically 24y further than that of the 5hcp player, a significant difference. A common theme that regular readers will be fed up hearing is the importance and impact of distance.
The distance difference – approach play.
Our 0hcp golfer reaps the rewards of hitting it longer than other players when it comes to second shots, let’s exemplify this with a hypothetical 420y Par 4.
Below we have data on a scratch player and the two closest Handicap Benchmarks.
| Hcp | 0 | 5 | 10 |
| Driver P-Avg. | 285y | 261y | 259y |
| Distance Remaining | 135y | 159y | 161y |
| Club Choice | PW | 7i | 6i |
| Green Hit % | 58% | 37% | 27% |
The table above highlights how much of a difference the added length off the tee makes for the scratch golfer when playing into the green.
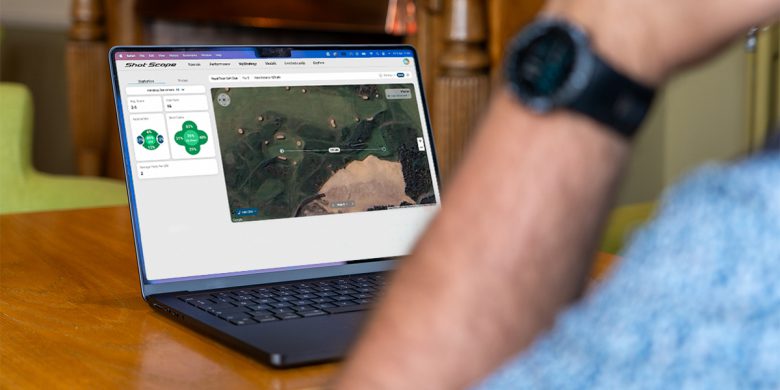
If you want insight like this into your game as well as over 100 tour level statistics, including Strokes Gained, check out Shot Scope performance tracking technology.
It is worthwhile mentioning that the additional length is not exclusive to the driver and translates throughout the bag, as you would expect.
Regardless, a pitching wedge versus a 7 iron is an astronomical difference and we can see this in terms of green hit.
For their second shot, the scratch golfer hits the green 6 times out of 10 attempts. Our 5hcp will hit the green with their second shot just shy of 4 times in 10 attempts and lastly the 10hcp is roughly 3 times in 10 attempts.
So our scratch player is twice as likely to hit the green compared to the 10hcp golfer. It is also interesting to see how the 10hcp and 5hcp compare as it highlights the jump from a 5hcp to scratch.
We can see that length wise, the 5hcp is not significantly longer but is 10% more likely to hit the green as mentioned above. Whereas, the scratch golfer in comparison to a 5hcp is a considerable jump.
Although the difference in strokes is the same from an index perspective, the way they play is very different.
Lets look now to short game.
The key metrics for short game are up and down success as well as proximity to the pin, which are both linked – closer proximity = greater chance of converting up and down.
| Hcp | 0 | 5 | 10 |
| Up and Down % | 54% | 47% | 39% |
| Proximity (ft) | 11ft | 14ft | 15ft |
From inside 50y we can see that our scratch player is more likely to get up and down than not with a 54% chance of converting, slightly better than 1 in 2 attempts.
Our 5hcp is just shy of the 50/50 chance and our 10hcp converting roughly 2 in 5 attempts.
You may think that the proximity differences between the benchmarks is not that large. However, would you rather a 3ft putt or a 6ft putt?
There can be only one answer and that is because of make percentages when putting.
Every foot counts on the green.
Using our inside 3ft versus 3-6ft putting stats we can see just how big a difference this makes to the likelihood of the amateur making their putt.
| Hcp | 0 | 5 | 10 |
| Make % 0-3ft | 98% | 96% | 96% |
| Make % 3-6ft | 76% | 67% | 65% |
The scratch player is 22% more likely to make their putt from inside 3ft as opposed to beyond it. Our other benchmarks also see a significant increase in the likelihood of making their putt from the closer distance – as we would expect.
Interestingly, we again see the very similar stats of the 5hcp and 10hcp whilst noticing the roughly 10% difference from them to the scratch. This trend continues as we move further away from the hole.
It is the culmination of these small differences on the green or the large differences off the tee that add up over the course of a round, and season, which creates this divide between the scratch golfer and everyone else.
If you would like insight like this into your game, Shot Scope performance tracking products give golfers over 100 tour level performance insights into their game for FREE, forever.
