Was the $500 investment on a new Driver worth it?
8 August 2019
One of our golfers decided enough was enough and they should invest in a new driver for the golf season. The purpose of this is not to enhance a specific club or brand but to discuss and show the merits in custom fitting and understanding performance data.
The question posed to Shot Scope: Was the $500 investment worth it?
Firstly, about the driver change. The original driver (Driver_Old) was from a well known brand and purchased new in 2009, it had an extra stiff shaft with 9 degrees loft. The new driver (Driver_New) is actually the newest release from the same brand and has an extra stiff shaft with 10.5 degrees loft.
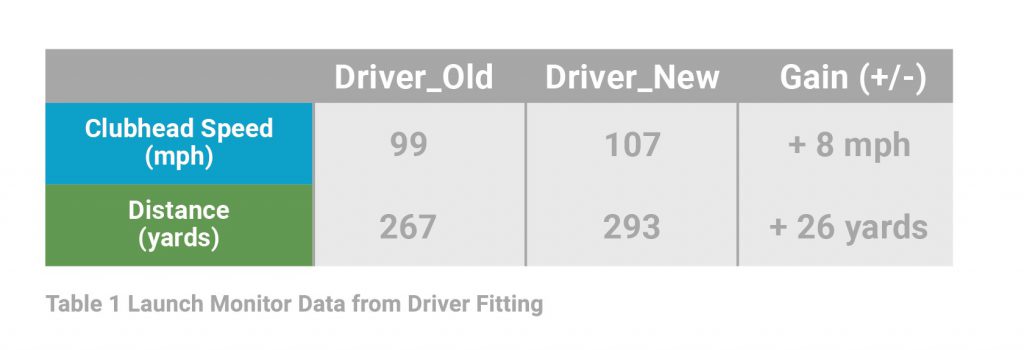
During the fitting process, multiple drivers and shafts were tested. Driver_New was found to go on average 26 yards further (using a Launch Monitor) than Driver_Old.
Discussing with the golfer, he said that he felt he was playing better with the new Driver and had lowered his handicap from 8.8 to 7.2 already this year but attributed that improvement to other areas of his game.
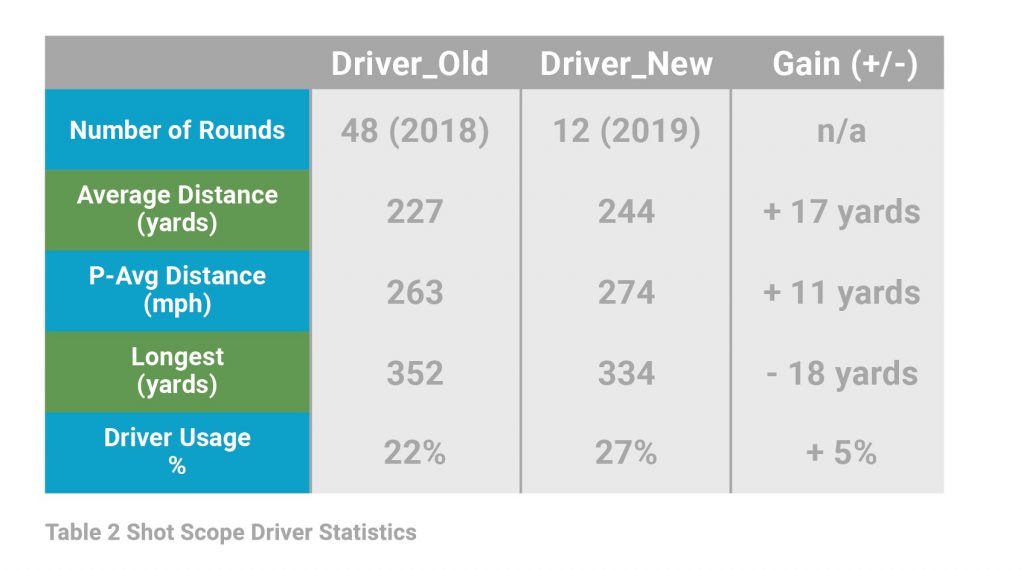
Looking through his Shot Scope performance data:
It is obvious to see that Driver_New is longer than Driver_Old, using Average Distance it is 17 yards longer and if we look at P-Avg (Performance Average) it is only 11 yards longer.
*Shot Scope recommend users refer to their P-Avg Distance (Performance Average) as it removes all outliers good and bad, to give the user a true representation of how far they hit a good shot.
This isn’t the 26 yards we are looking for from his fitting, but there is a caveat to this performance data. In 2018 summer golf in the UK was played on unusually hard and fast conditions creating some long drives such as his longest at 352 yards.
The main takeaway from his distance statistics is the consistency. Driver_Old had a 36 yard difference between average and performance average, whereas Driver_New has reduced that difference to 30 yards. Not only is Driver_New longer, it has better distance consistency as well.
This unsurprisingly has created an increase of confidence with Driver_New, resulting in a higher usage % of 27% compared to Driver_Old’s 22%.
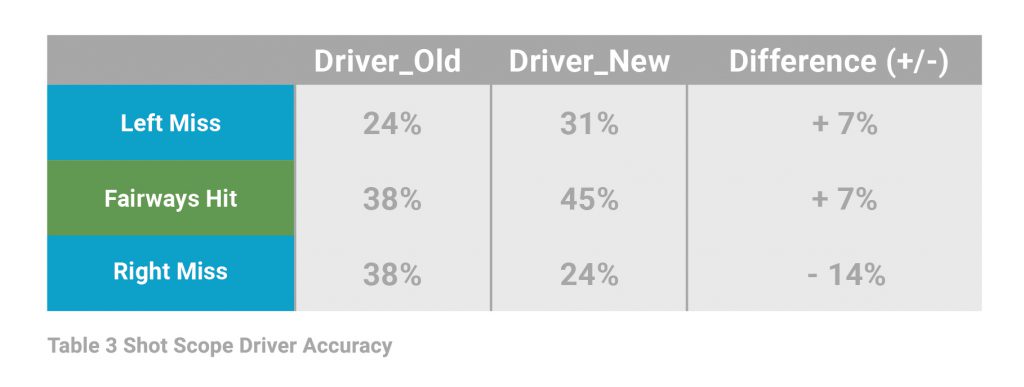
The question is, has this resulted in more fairways being hit, well yes!
We can see from his Shot Scope performance statistics that he has now increased his fairways hit % to 45%, up 7% from Driver_Old. As well as hitting more fairways he has minimised his right miss by 14%, now down to 24% with Driver_New.
Looking into this further we discover that his misses are infact smaller misses with Driver_New.
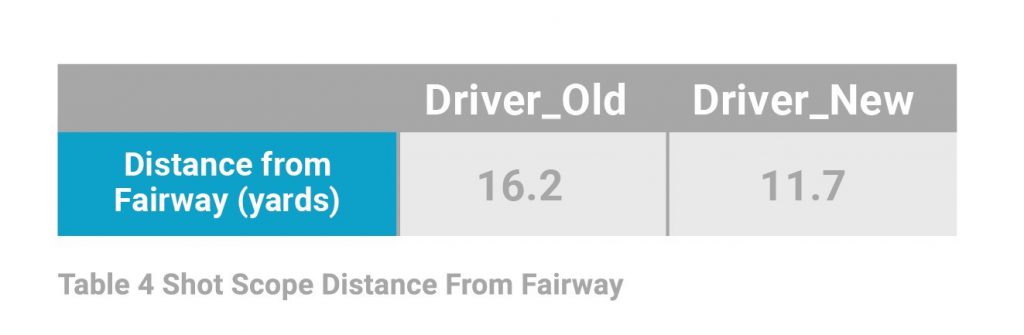
His average non-fairway hit with Driver_New is only 11.7 yards from the fairway whereas with Driver_Old it was 5 yards more off-line at 16.2 yards.
With the help of understanding performance statistics from Shot Scope we can conclude that Driver_New is longer, more consistent and more accurate off the tee than Driver_Old, but the following question is, did the new driver lower his scoring?
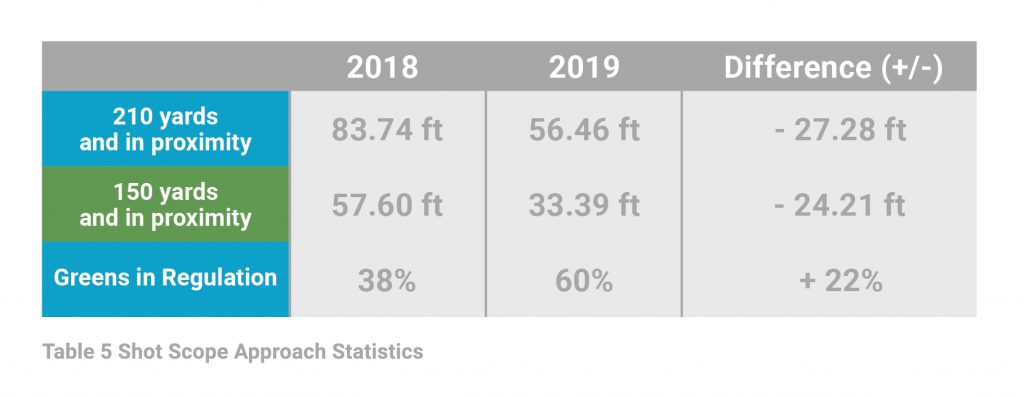
The next area to look into is his approach shots:
He has increased his Greens in Regulation by a massive 22% in 2019. Not only this, but he is hitting the ball considerably closer to the pin compared with last year – over 20ft closer! There is no doubt that this is due to him hitting more fairways and being more accurate off the tee with Driver_New. Subsequently, leaving himself better approach shot positions, with more approaches from fairways and less from a long way offline.
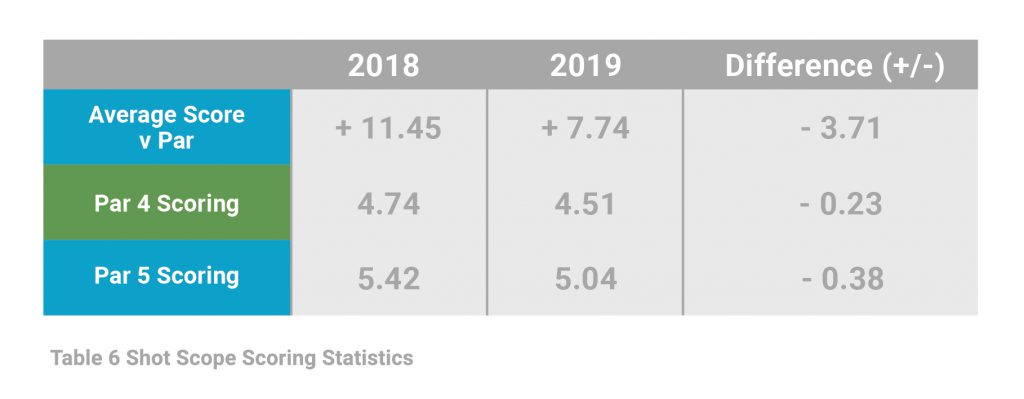
As the golfer mentioned he has lowered his handicap and Shot Scope statistics shows this with his scoring improvements.
Total round scoring has improved by 3.71 shots, with Par 4 and Par 5 scoring both improving due to his better driving and subsequent approach performance.
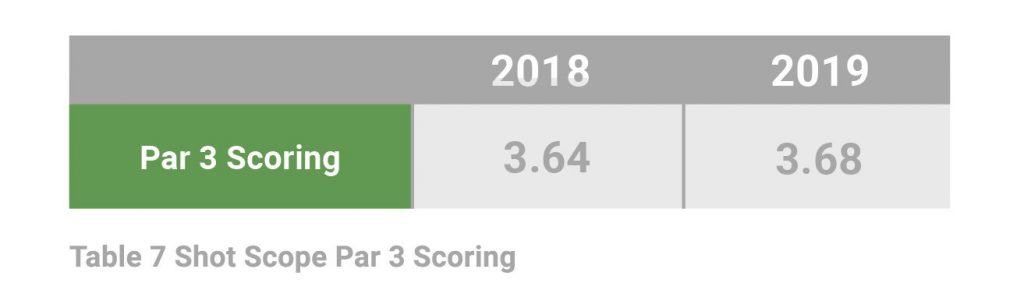
A great way to show that the improvement can be attributed to Driver_New is through the fact that his Par 3 scoring has remained static.
It is evident that custom fitting can improve scoring, it should be noted that this case is dramatic as there was a 10-year gap in the technology of the Drivers.
Most importantly one Shot Scope user can sleep soundly knowing their $500 investment was worthwhile and can be even more confident in using his Driver to find more fairways.
Understanding Shot Scope performance statistics can help provide a golfer with better knowledge of where they can improve their game, alongside allowing them to see any changes over the years just as in this example. Knowing how to analyse and understand statistics of this type can be hugely beneficial to your game. For more information on Shot Scope visit shotscope.com.