Analysing Putting: 3 Putts, % and more
29 August 2019
Putts per Round and Overall Putting %
Shot Scope findings on putting arguably offer the biggest opportunity to save shots. The high percentages of three-putting across all levels, coupled with evidence of poor distance control, indicates a fast track to lower scores. Another neat feature of Shot Scope is the ability to track your performance with a range of different putters. This way, a clear pattern will emerge of which one works for you, and which ones don’t.
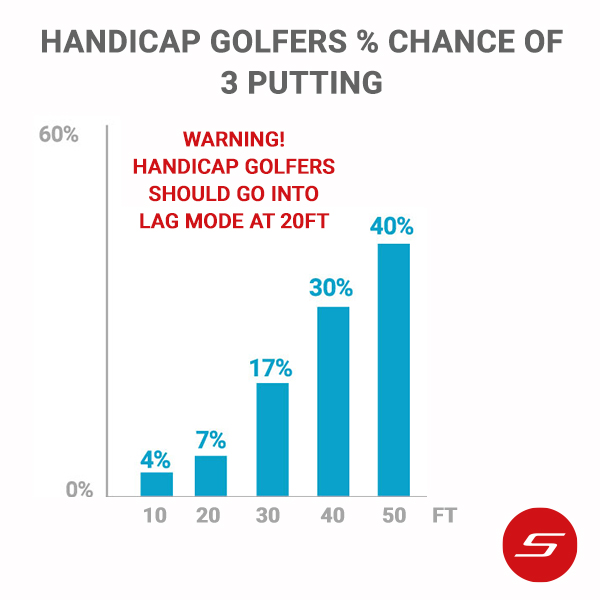
Handicap golfers % chance of 3 putting
The average first putt distance for a handicap golfer is 18.5ft. Effectively, most 3-putts are made from more than 20ft. So it is key to think ‘lag’ from around the 20ft mark. Lagging does not mean leaving it short, but the goal should be to two putt and make the second putt as short as possible to reduce stress.
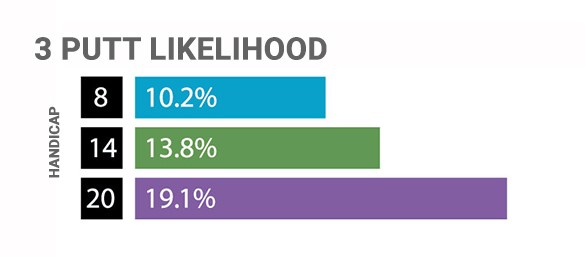
3-putt likelihood
A massive key for scoring for the handicap golfer is to avoid three putting – do this well and it can significantly reduce your handicap. The 3 putt percentage is surprisingly high over the various handicaps, with 20 handicappers three-putting 19% of the holes they play. There is a lot of room for improvement!
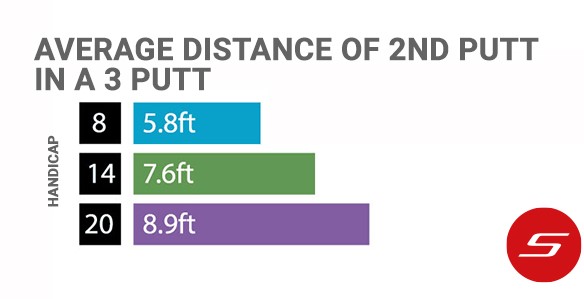
Average distance of second putt in a 3 putt
Even more surprising is the average distance of the second
putt when three-putting. A 20 handicapper has a second putt of nearly 9ft!!
This is predominantly a distance control issue, because the ball usually comes
up short. Even Jordan Speith – one of the best putters in the world – only
holes a 9 footer 24% of the time, so what chance have you got?
As Shot Scope suggests, most three-jabs are cause by coming
up short… which is most often a question of strike quality. A pure strike means
optimal energy transfer into the ball; mistrikes mean less energy and less
distance. To improve your strike on longer putts, let your core take control of
the stroke.
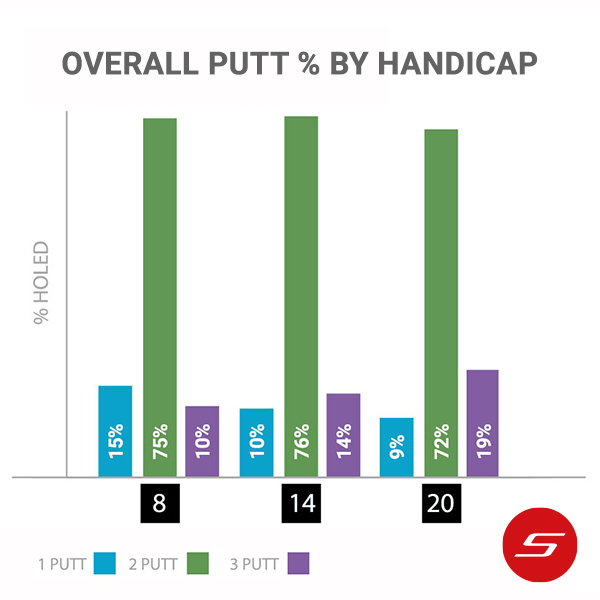
Overall Putt % by Handicap
This is a fascinating graph. There doesn’t seem to be too many differences between handicaps, but on closer inspection there is a significant swing between 8 and 20 handicappers on one and three putts. Two putts stays relatively constant by handicap.
The 3-putt % difference between an 8 handicap and higher
handicaps is down to consistency of the putting stroke. An 8 handicapper is
likely to have a more consistent putting stroke than a 20 handicapper, meaning
they have more control over the distance they hit their first putt. We
uncovered earlier that 3 putts tend to happen due to a poor first putt, which
is often due to a miss-strike on inconsistent putting stroke.
Top Tip: When using the PinCollect feature, include all shots taken with a putter. For example, 1 putt from off the green and 2 putts on the green = 3 on PinCollect.
shotscope.com captures data from all around the world. It is used globally in 52 countries. Shot Scope are the innovators of the first ever golf watch with both GPS and Performance Tracking combined in one device. Go to shotscope.com to find out more.