Ryder Cup: USA v Europe Club Golfer Performance
25 September 2023
Using Shot Scope data, we have created our very own Ryder Cup using amateur golfer data from 1000 Americans and 1000 Europeans.
Unlike the Ryder Cup in Rome, this will be won and lost based purely on statistics to see which side of the Atlantic has the best amateur golfers in the game!
Data has been recorded using one of the various performance tracking methods Shot Scope offer, including the X5 GPS watch, PRO LX+ laser rangefinder, and CONNEX the subscription free mobile enabled performance tracking tags.
Note: the players chosen to represent their team had the same combined score to par in 2023.
Some overarching contextual stats.
The data highlighted some interesting statistics around golfing habits. European players play golf more often with an average of 5.76 rounds per month, whereas US golfers average 4.28 rounds per month.
Similarly, Europeans play slightly more courses than their American counterparts, playing 2.84 courses per month compared to the Americans who averaged 2.36 courses per month. Interestingly, the courses played by US golfers tend to be slightly longer, typically 63 yards.
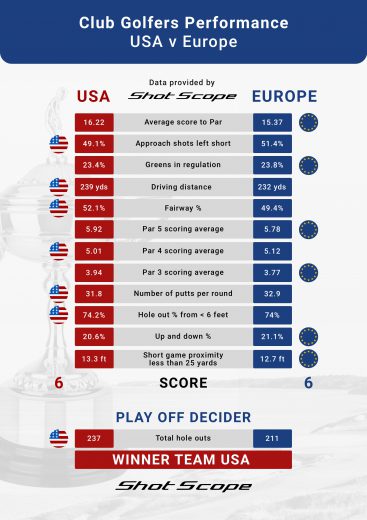
The article will break down the 12 performance statistic matches in the graphic below.
Match 1 – Scoring Average
First blood goes to Team Europe who average almost a full stroke less than Team USA per round.
USA 0 – 1 Europe
Match 2 – Approach shots left short
Shot Scope data reveals that the most common miss amongst amateurs is short, typically 46% of the time. On average Europeans miss short 2% of the time more often than American amateurs. USA bounce back.
USA 1 – 1 Europe
Match 3 – Greens in Regulation
The closest match of the performance statistic Ryder Cup. However, the Europeans take the point by the slimmest of margins.
Approach play is one area where every amateur can improve, missing short is easily avoided by clubbing up or playing to the back of the green yardage.
USA 1 – 2 Europe
Match 4 – Driving Distance
The stat that always captures attention from amateurs, how far do you hit it? Well, Team USA have the bigger hitters, averaging 7 yards more off the tee compared to Team Europe.
USA 2 – 2 Europe
Match 5 – Fairway Accuracy
Across all handicap levels of amateurs, the smallest difference in performance is found here with fairway accuracy percentage.
Team USA come out on top in back to back matches to take the lead for the first time.
USA 3 – 2 Europe
Match 6 – Par 5 Scoring Average
Despite being shorter off the tee and hitting less fairways, it is Team Europe who perform best on Par 5s and bounce back to level the match.
USA 3 – 3 Europe
At the halfway point, we are all square.
Match 7 – Par 4 Scoring Average
Neither Team USA or Team Europe score fantastic on Par 4s, both averaging a bogey at best but the point goes to Team USA. Perhaps we should all look to improve at Par 4s!
USA 4 – 3 Europe
Match 8 – Par 3 Scoring Average
A hard fought match but the Europeans level the match once more.
How can you improve on Par 3s? Manage your expectations and improve on your club selection, a typical 15 handicapper misses a Par 3 green from 150-200y 81% of the time!
USA 4 – 4 Europe
Match 9 – Average Putts Per Round
Averaging an impressive full stroke less on the greens per round, once again Team USA edge into the lead.
USA 5 – 4 Europe
Match 10 – Holing out inside 6ft
Finishing strong at crunch time, US golfers take the win by a small margin of 0.2%.
USA 6 – 4 Europe
Match 11 – Up and Down
Scrambling for a point, Team Europe win the match for up and down success in the penultimate game.
USA 6 – 5 Europe
Match 12 – Shot Game Proximity from <25 yards
Miraculously, Team Europe keep the dream alive and tie things up! We’re going to a play-off!
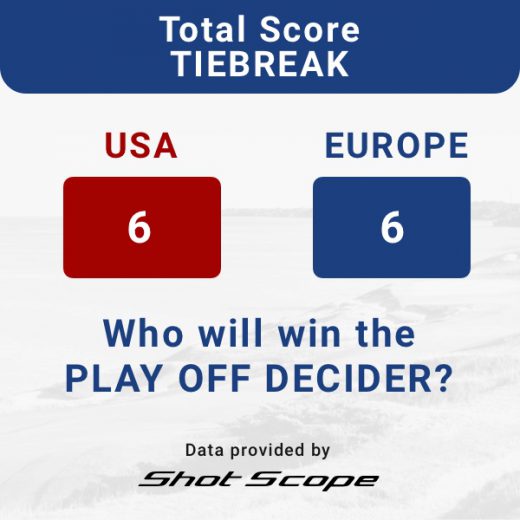
USA 6 – 6 Europe
After a hard fought 12 match statistical battle, Team USA and Team Europe are tied at 6 points each. A final one match play off was required to separate the sides.
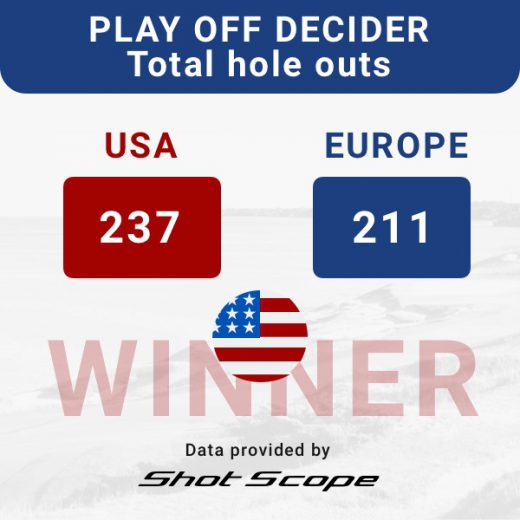
To decide the winner, the play off is decided in exciting fashion, looking at hole outs – a shot holed from off the green.
The statistical Ryder Cup of 2023 is won by – TEAM USA!
A tightly contested match between Shot Scope users on both sides of the Atlantic. The question is, who will win in Rome this September? If it is anything like the Solheim Cup, we cannot wait!
Shot Scope offer a range of golf GPS watches and laser rangefinders designed to help golfers improve their game. Tracking more than 300 million shots around the world!
Shot Scope users on average improve their handicap by 4.1 shots after using the performance tracking products for 30 rounds.
www.shotscope.com