- Game Improvement
- Golfer Case Studies
- Course Strategy
- Shot Scope Data
- Free Golf Improvement Ebooks
Most Popular
- Why Shot Scope?
- Why Shot Scope?
- Blog
- Superior Course Mapping
- Customer Care
- Latest Features

Understanding Strokes Gained: How it works
Shot Scope Blog
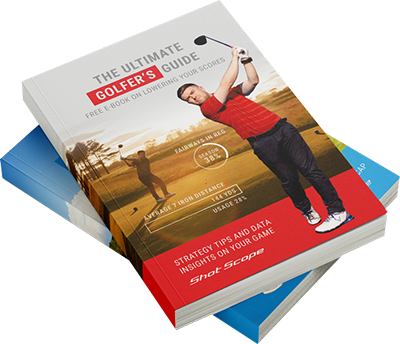
Start lowering your scores today with our Free Golf ebooks
Get my e-books
- Sale
-
- WHY SHOT SCOPE?
- Why Shot Scope?
- Superior Course Mapping
- Customer Care
- Latest Features
- Coaching Platform
-

-
- Change country >
- Select a country below to change region:
- Australia
- Canada
- Europe
- Japan
- New Zealand
- United States
- United Kingdom
- Rest of the world
- Login to Dashboard >
- Blog >
- Download Free Golf e-book >