With over 100 performance statistics available to our shot tracking users, some may find themselves wondering where to look – fear not this blog has you covered.
This blog will provide you with some of the top-level statistics that are worth keeping an eye on within the Shot Scope mobile app and web dashboard
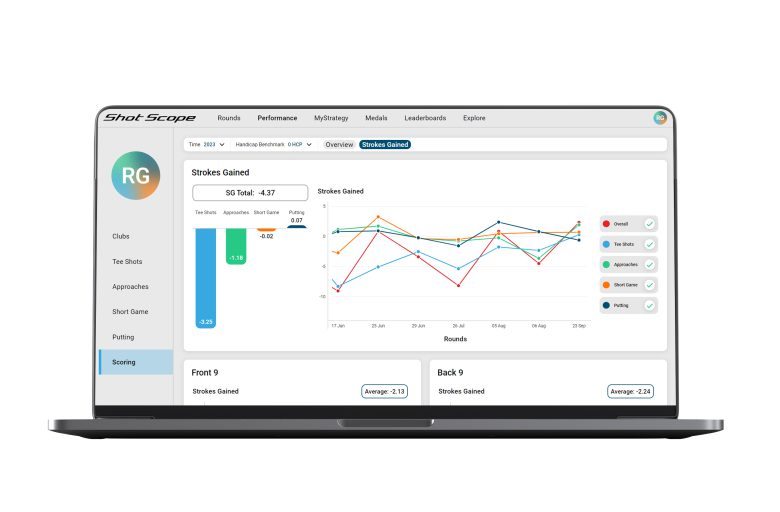
A snapshot of your game can be found in the scoring section.
Within the scoring section, we can see our score breakdown, score to par, back nine versus front nine, and par breakdown. All useful stats but if you are looking for a very quick way to find your focus, look at Strokes Gained within scoring.
Shot Scope Scoring Statistics
With the example shown, we can see a clear issue – tee shots!
When we look at the overall strokes gained plotted on the graph, we can see that in rounds where tee shots were better, the overall strokes gained are better – usually.
Upon identifying this issue we can head over to the tee shots data and further analyse what is causing the issue.
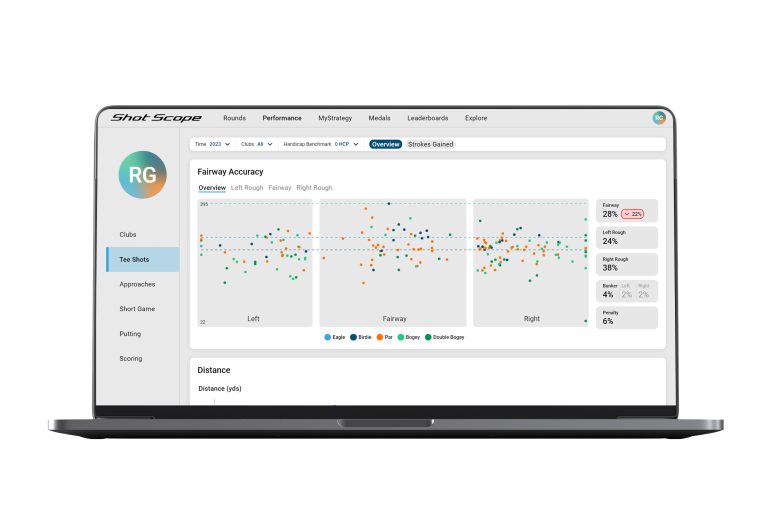
Looking more closely at tee shots, something becomes apparent – erratic off the tee.
Shot Scope Tee Shot Statistics
Immediately, we are met with some harrowing tee shot statistics (I know the player so can say that!). A destructive two way miss and tendency for the odd penalty stroke is costing the player dearly.
There is a preference to the right fairway but knowing that the left miss can pop in from time to time makes it difficult to commit to aiming down the right side.
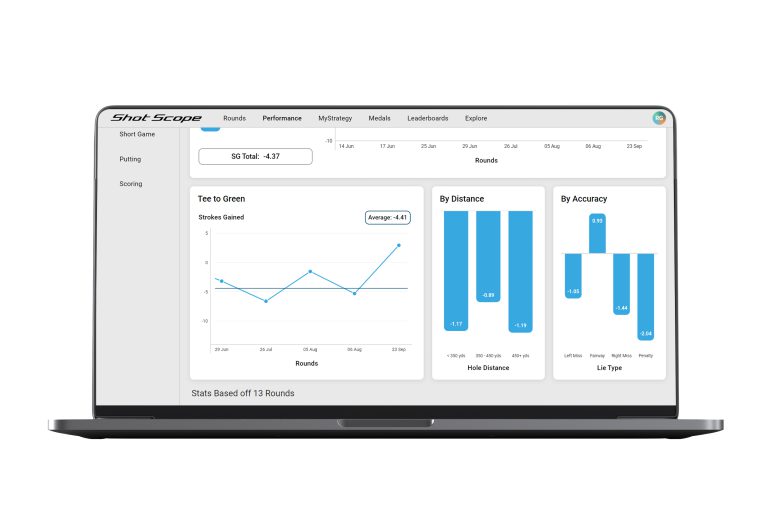
When we look at Strokes Gained, the reading is equally ugly.
Shot Scope Tee Shot Statistics Strokes Gained
Everything on this screen paints a bad picture off the tee with the exception of gaining nearly a full stroke when finding the fairway.
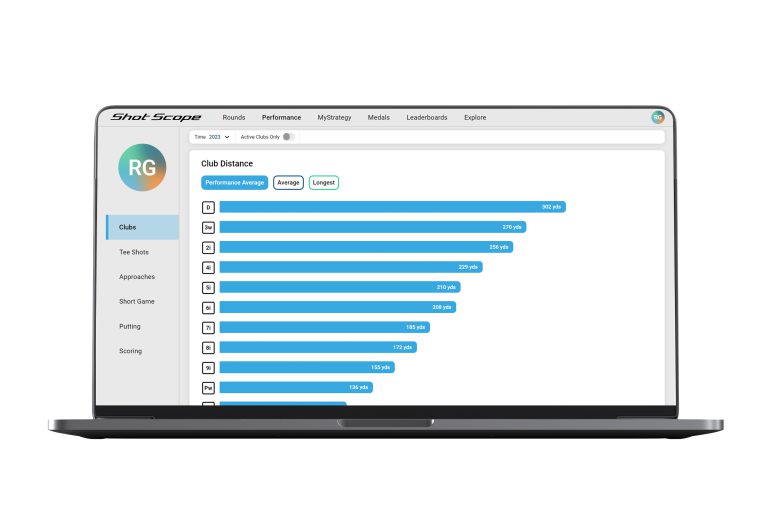
We now look to club distances to see if there is any further insight that can be gained.
Shot Scope Performance-Average Club Distances
We can see that the player has plenty of length off the tee but is not putting it to good use with their wild tendencies off the tee box.
This would suggest that the player needs to work on consistency as they have above average length, they just need to control it.
If the player were to lose 10y off the tee but hit 10% more fairways, or reduce their number of penalty strokes, significant improvements to overall Strokes Gained and scoring would result.
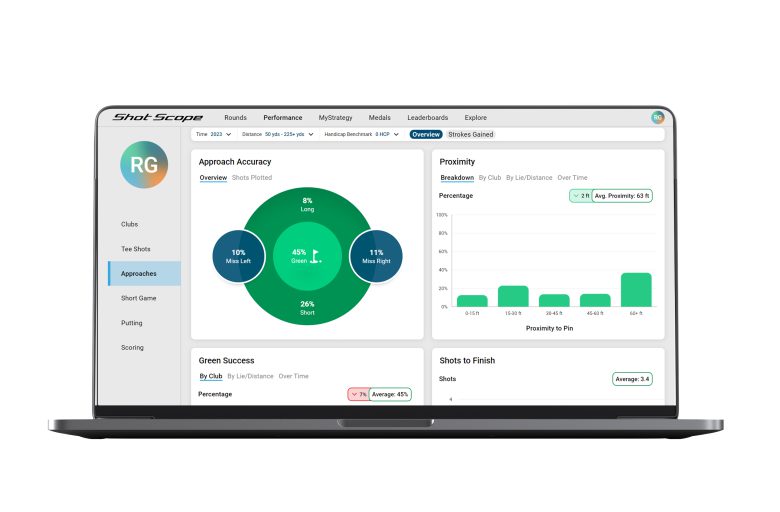
Moving onto approach shots.
For all approach shots played, the player is hitting 45% of greens which is quite good, but below the Handicap Benchmark by 7%.
Shot Scope Approach Shots Overview
What aspect of approach play is not up to standard? Close range!
Shot Scope Approach Play Strokes Gained
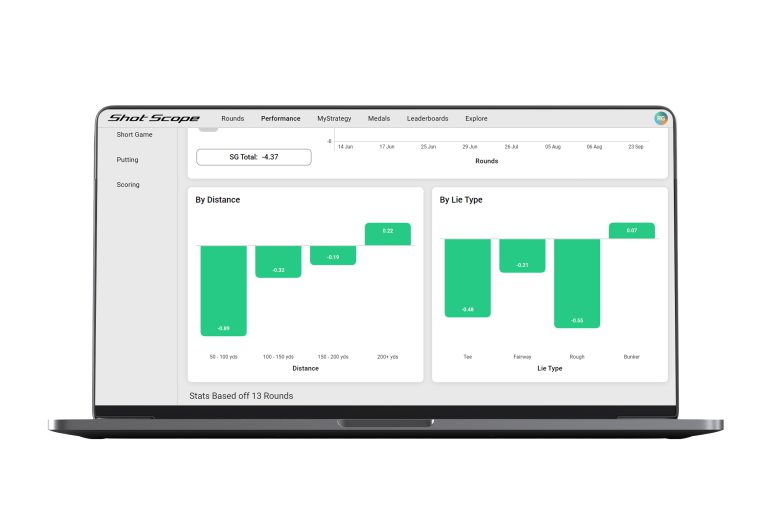
Looking at Strokes Gained approach play, we can see that from 50-100y the player is losing the majority of their approach strokes.
Likewise, another area to look at in the above screenshot, losing almost as many strokes from the rough as the tee! Perfect lie and placement on the tee and yet the player is better from a fairway lie.
When we think of tee shots and approach play, it would appear that the player is lacking some finesse.
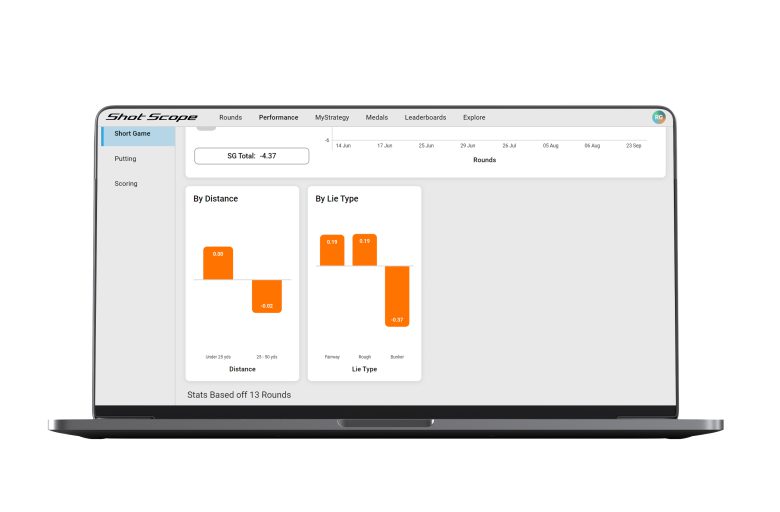
Looking at short game, not too much to report on.
The player does not get up and down as often as they should, failing 9% more often than the handicap benchmark. Practice inside 100y would be another area to consider.
Other than that, Strokes Gained Short Game looks pretty good, a little bunker practice wouldn’t go a miss.
Shot Scope Short Game Strokes Gained
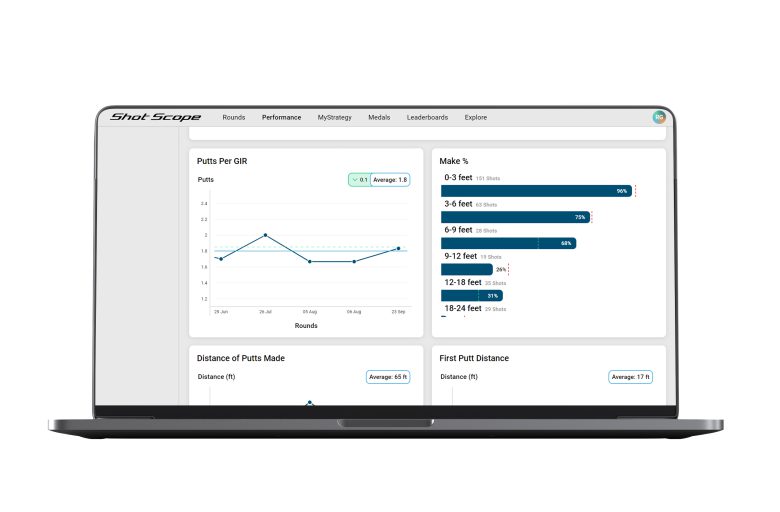
Lastly, we look to putting.
Putting is pretty much on par for the Handicap Benchmark, missing a couple of close range putts, 2% below the benchmark.
On a more positive note, you are making more putts from 6-9ft than the Handicap Benchmark and likewise for 12-18ft.
Shot Scope Putting Statistics – Make Percentage
Work on your 0-3ft putts as these are must makes for lower handicap players.
So there you have it, how you can analyse your Shot Scope stats.
If you would like a more in-depth look at our stats, the eBook linked at the top has the answers.
Our performance tracking statistics are available for free, for life, with the purchase of any one of our shot tracking products.
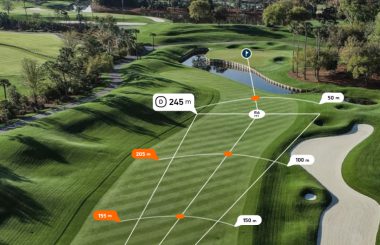
In addition to the priceless statistics, our users also gain access to full course aerial maps and MyStrategy, the ultimate data-driven strategy builder.
The future of golf, and lower scores, is powered by Shot Scope.
Did you know that 84% of missed putts over five feet finish short?
Or, that your typical drive is nearly 30 yards shorter than your Sunday best drive? These are just two intriguing statistics thrown up by Shot Scope’s performance tracking data platform.
Download our free guides for golfers now!