The recent update to the Shot Scope app reveals new performance pages with some new statistics and different styles of graphs. This article will outline the changes and help explain what some of the new graphs mean.
Inline with our continuous user testing and customer requests/feedback, we have updated the performance pages. The updates to the performance pages also allows for the phased implementation of our strokes gained analytics. Please note, these changes are currently only available on our mobile app and will benefit Shot Scope performance tracking products (V1, V2 and V3).
Please make sure you have the latest Shot Scope app version:
iOS app version: 2.9.7
Android app version: 3.6.0
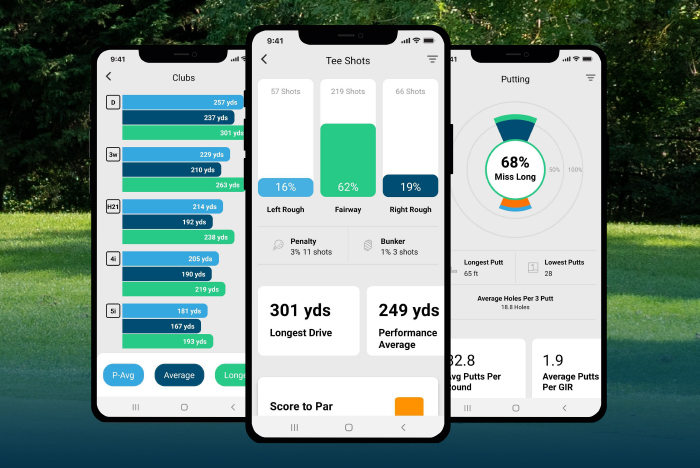
Each performance page (clubs, tee shots, approaches, short game, putting and scoring) has been updated with new graphs and charts. Some of the graphs are clickable and open a new graph, others you can slide left to right to see more statistics.
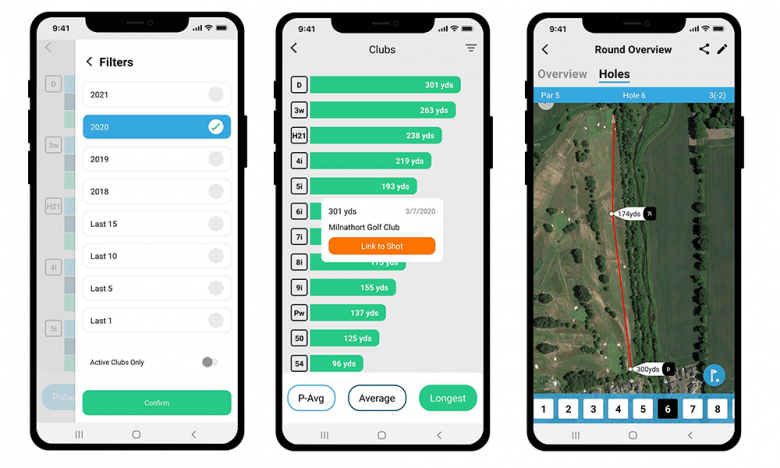
Filtering
Across all performance pages there are new filter options (the filter icon is in the top right when on a performance page). You can now filter by Year, last 15, last 10, last 5 and last 1 round(s). The default selection is last 10 rounds. If you change the filter to 2020 for example, the filter will be saved regardless of which statistics or performance page you go into. You can then go into the filter again and change as you wish.
You will also notice after selecting a filter, that the performance pages now show the number of rounds and shots included in the statistics shown.
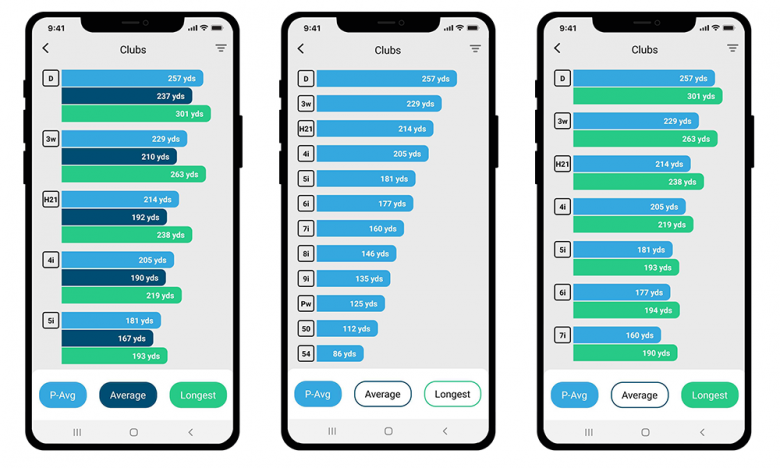
Clubs
The clubs page has been redesigned with some new functionality. You can select to view the Shot Scope P-Avg (performance average), average and longest all at the same time, individually or any combination of the 3.
We have added a couple new features to this page:
Active club filter
View the longest shot
One new feature we have added is the ability to link to the longest shot hit with each club. Simply tap on the longest shot distance, and click through to see the shot, hole and course.
The second is the ability to select active clubs only. Simply toggle this ‘on/off’ as you require. An active club is a club that is included in ‘My Bag’ on your account.
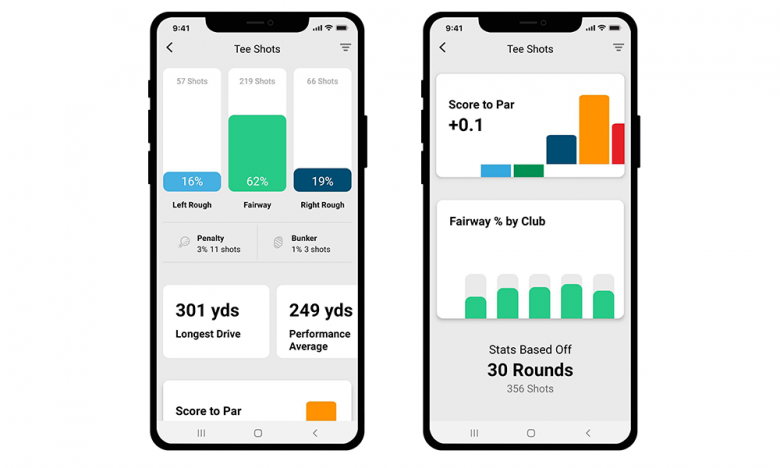
Tee Shots
The main change to the tee shots page is a new style of graph for the tee shot dispersion – which now includes bunkers and tee shots that result in a penalty.
There are also the following statistics:
Score to par
Fairway % by Club
The score to par on tee shots shows how wayward shots are impacting your score. This makes it easy to see exactly where you perform best from, and where you should avoid hitting your tee shot. You can also tap each coloured bar to see the score to par for each lie type.
The fairway % by club helps to see which clubs really help or hinder you off the tee. Perhaps it is your hybrid that hits the most fairways off the tee? This breakdown also shows the number of shots with each club. For example, your stats could show you hit 100% fairways with your 3 wood, but you only used it once, so you should take this into account when analysing your performance.
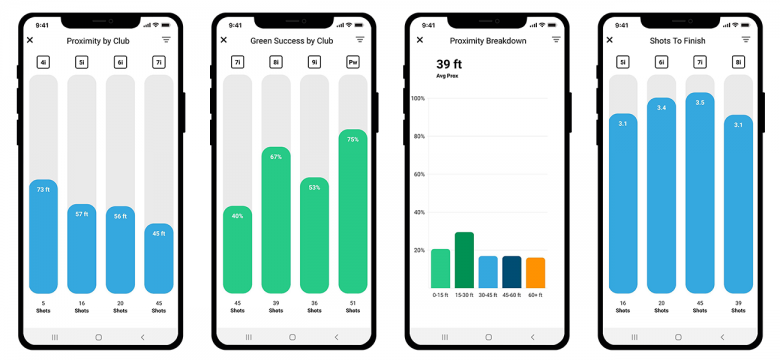
Approaches
Approaches have been refreshed with much more detail available than previously on the app. Statistics included under approaches are:
Hit/Miss Green Overview
Green Success by Club
Proximity Breakdown
Proximity by Club
Shots to Finish by Club
Most of these are clickable graphs that expand as shown. The proximity breakdown highlights the % of shots in each defined distance from the pin (0-15ft, 15-30ft etc), as well as giving an overall average proximity at the top. You can also tap each bar to find out the exact % in each distance range.
Looking into the other charts, it is now quick and easy to see which clubs are performing the best, taking into account proximity, green success % and shots to finish. The shots to finish included the first shot hit e.g. 150y away, hit a 7 iron and 2 putt, shots to finish for the 7 iron = 3.
Short Game
Similarly the short game stats have a new look and there is much more detail available than previously on the app. Statistics included under short game are:
Average Proximity
Proximity Breakdown
Proximity by Club
Up & Down %
Sand Save %
Shots to Finish by Club
Most of these are clickable graphs that expand as shown. The proximity breakdown highlights the % of shots in each defined distance from the pin (0-15ft, 15-30ft etc), as well as giving an overall average proximity at the top.
Again, these charts make it easier to identify the best performing clubs for short game. Taking into account proximity, up & down and shots to finish for each club will allow you to identify the clubs that perform best around the greens for you.
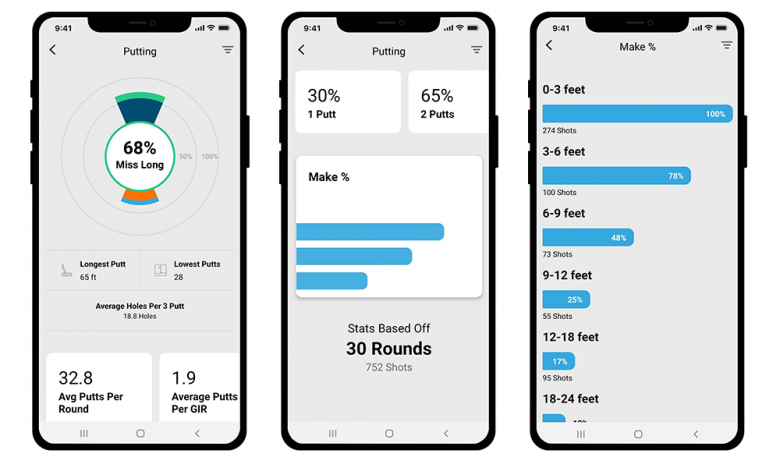
Putting
The new putting graphs offer interesting stats we have never looked at before in the app. There is:
Average Putts per Round
Average Putts per Green in Regulation
1 Putt, 2 Putt and 3 Putt %
Make % by distance
Longest Putt distance
Lowest Putts
Average Holes per 3 Putt
The Make % graph is clickable and opens to expand more detailed breakdowns – make % in defined distances 0-3ft, 3-6ft, 6-9ft and so on. You can also tap on the main circular image – the colours represent how long or short a putt missed the hole by as below:
Green = Long
Dark blue = Long but within 3ft
Light blue = Short
Orange = Short but within 3ft
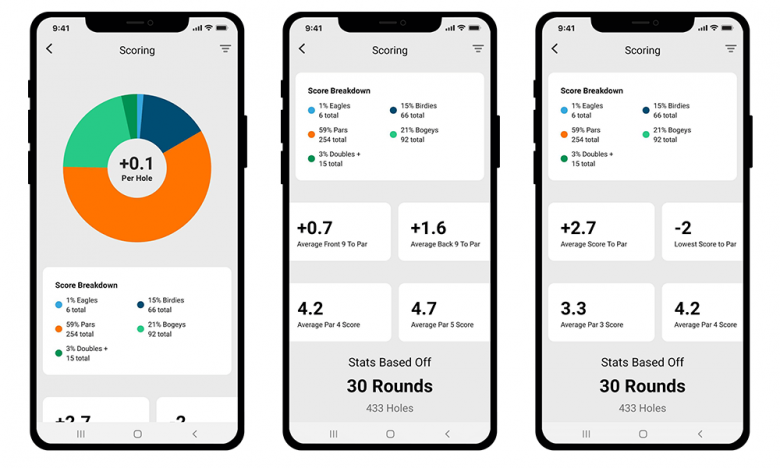
Scoring
This page is a new section we have added to the app, where scoring is looked at and broken down for you.
Average Score per Hole
Score Breakdown
Average Score to Par
Lowest Score to Par
Average Front 9 and Back 9 to Par
Par 3, Par 4 and Par 5 Average Score
On this page there are currently no clickable graphs, but you can scroll/slide left and right to see more of the white boxes. Again this page shows the number of rounds and number of holes the statistics are based off. This can be changed using the filter in the top right corner.
Conclusion
Hopefully this article has helped explain some of the new statistics we have produced, and help you understand how you can use them to help your game.
If you haven’t already, we highly recommend downloading our free e-books, which take a much deeper dive into the statistics available on the Shot Scope platform and how you can use them to help you improve your game.
Did you know that 84% of missed putts over five feet finish short?
Or, that your typical drive is nearly 30 yards shorter than your Sunday best drive? These are just two intriguing statistics thrown up by Shot Scope’s performance tracking data platform.
Download our free guides for golfers now!