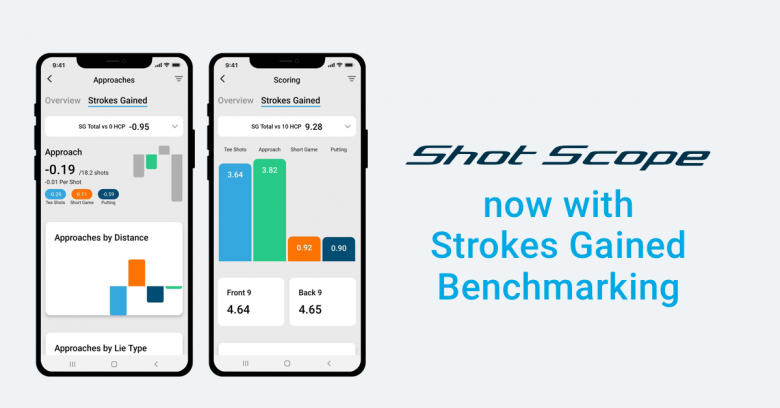
Shot Scope Strokes Gained now includes benchmarking against 6 different handicaps. The new update to the mobile app has more detailed performance statistics available, including deeper strokes gained analysis on all areas of the game.
The latest mobile app versions:
iOS app version: 2.9.13
Android app version: 3.7.1
Benchmarking will allow Shot Scope users to see where they compare to golfers of a similar ability and allow them to set goals based on each defined benchmark. Golfers can identify the areas of the game they perform strongly in compared to others but also compare against a lower handicap benchmark to help identify key areas for improvement. This allows realistic performance goals to be set, when aiming to reduce their handicap.
For example an 8 handicap golfer can compare their strokes gained statistics against a 10 handicap, and perhaps it shows that all areas of the game were better than the average 10 handicap (positive strokes gained). If the golfers select to compare against a 5 handicap, they may have some positive and some negative strokes gained, this will help them determine the area of the game they should look to improve going forward.
Each section of the mobile app now has a ‘Strokes Gained’ tab. This is where there are overall strokes gained analytics on each aspect of your game, as well as more detailed breakdowns such as Par 3 strokes gained and approach shots by distance and lie type.
Within each area of the game you can select the drop down arrow to choose the handicap benchmark to compare against. The benchmark will save as you change between pages (until you change it again).
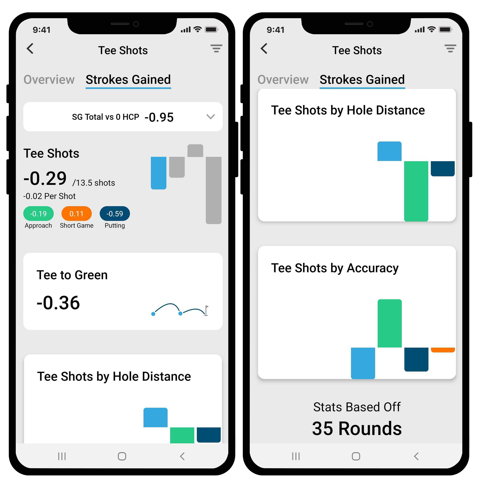
Strokes Gained Tee Shots
Tee shots shows the overall strokes gained for tee shots, as well as based on the distance of the hole and accuracy off the tee shot.
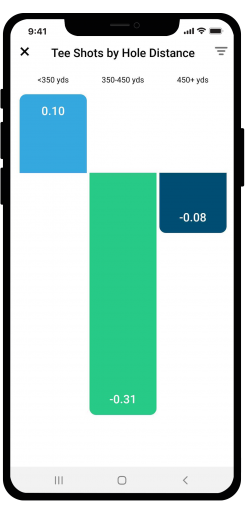
Strokes Gained Tee Shots by Hole Distance
This graph can be used to identify if you hit better tee shots on shorter or longer holes. In the image above you can see that on 350-450 yard holes the golfer ‘loses’ the most compared to shorter and longer holes. It is <350 yard holes is where this golfer ‘gains’ the most off the tee.
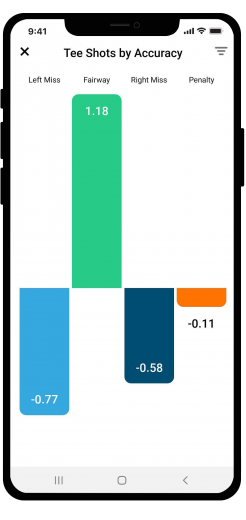
Strokes Gained Tee Shots by Accuracy
This graph takes a look at how the golfer performs depending on where their tee shot finishes. Perhaps obvious but this golfer gains more from being on the fairway whereas missing left and right is costing them shots, compared to the ‘defined benchmark’.
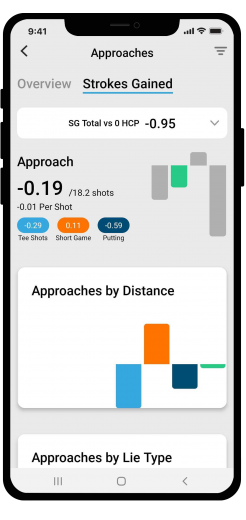
Strokes Gained Approaches
This page shows the overall strokes gained for approach play, as well as strokes gained for approaches based on the shot distance and lie type.
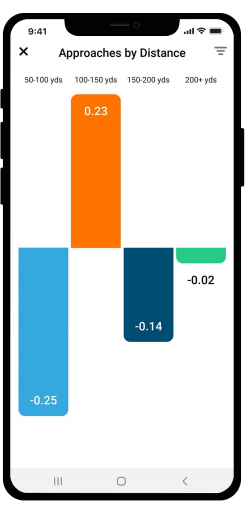
Strokes Gained Approaches by Distance
Approaches include all shots attempting to hit the green outside 50 yards from the pin. This also includes Par 3 tee shots.
Use this graph to identify your strengths and weaknesses within approach play. For the example above this golfer is good from 100-150 yards, but should focus on improve 50-100 yards.
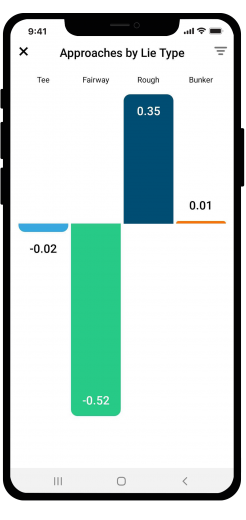
Strokes Gained Approaches by Lie Type
This image shows that the golfer needs to focus on improving their approach play from the fairway. Note – this graph includes Tee, which refers to Par 3 tee shots.
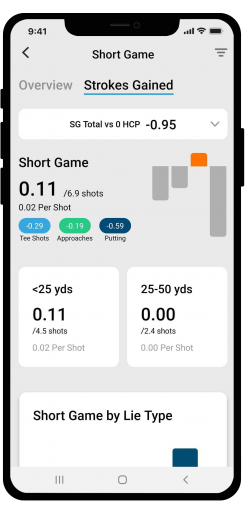
Strokes Gained Short Game
The main page shows the overall strokes gained for short game, as well as strokes gained based on the distance and lie type.
The 2 boxes <25 yards and 25-50 yards simply show your strokes gained based on each distance. In this case, the golfer is slightly better at <25y than they are from 25-50 yards, however neither is detrimental to their game (no negative numbers). It also gives a per shot value, which shows how much you gain / lose from each short game shot. Note – the number of shots shown is the average number of short game shots per round.
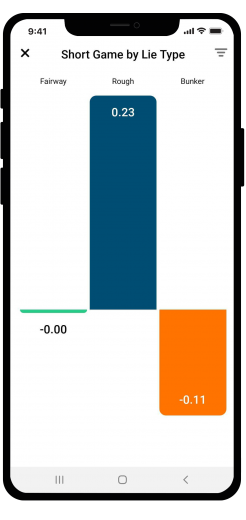
Short Game by Lie Type
This graph highlights that the golfer gains from the rough compared to the defined benchmark and that bunker play is an area they should focus on. Hitting a short game shot from the fairway has neither a positive or negative effect on their game.
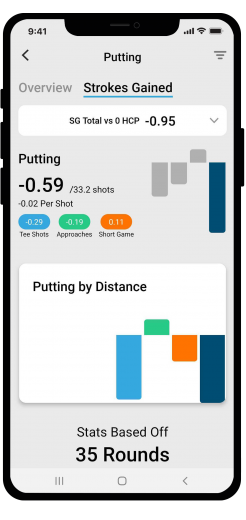
Strokes Gained Putting
The main page shows the overall strokes gained for putting, as well as a clickable graph which shows strokes gained for putting based on distance of putt.
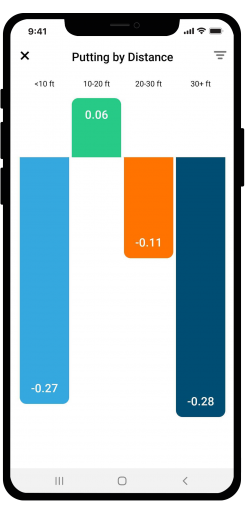
Strokes Gained Putting by Distance
This allows the golfer to breakdown their putting stats into various lengths of putts. Doing this can help identify if there is a key area they should focus on improving. In the image above, it is evident that the golfer is performing well at 10-20ft putts, but should focus on <10ft putts and also long putting 30+ ft.
Using this information alongside the traditional statistics you will be able to identify if it is pace control or holing out that the golfer needs to improve going forward.
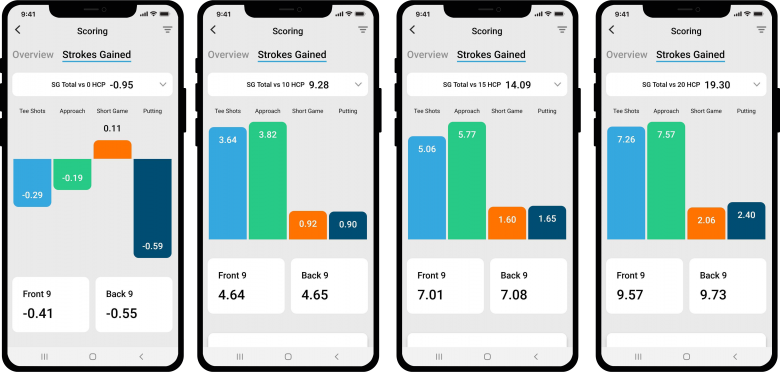
Strokes Gained Scoring
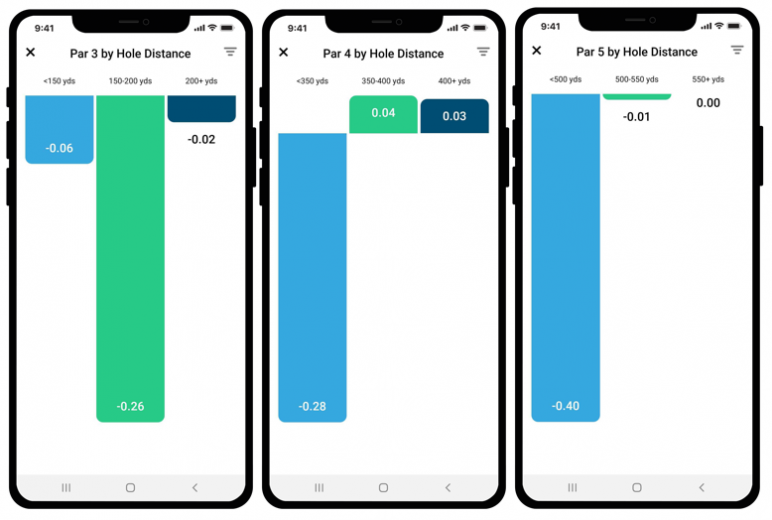
Par 3, Par 4 and Par 5 Strokes Gained
An analysis of Par 3, Par 4 and Par 5 performance through strokes gained allows golfers to focus on their weakness. For the examples above, the golfer plays Par 4s the best compared to the defined benchmark, as it is the only area with 2 positive results. 100-150 yard Par 3s, short Par 4s and short Par 5s should be the key area of focus.
This is where the golfer should then look to analyse their Tee shots on short Par 4/5s and see if there is an underlying issue. Perhaps they always layup too far back, or simply don’t get the ball in play enough.
Conclusion
The addition of handicap benchmarking to Shot Scope’s strokes gained and performance statistics makes it one of the most useful analytical tools for amateur golfers.
There are very few places where amateur golfers can compare their game against other amateurs as easily as within the Shot Scope app. The comparison against professional golfers is easy but often meaningless when it comes to your average golfer. Comparing against similar abilities allows for more detailed reflections and conclusions to be drawn about which areas of the game they are good at, and which areas need a little improvement.
If you haven’t already, we highly recommend downloading our free e-books, which take a much deeper dive into the statistics available on the Shot Scope platform and how you can use them to help you improve your game.
Did you know that 84% of missed putts over five feet finish short?
Or, that your typical drive is nearly 30 yards shorter than your Sunday best drive? These are just two intriguing statistics thrown up by Shot Scope’s performance tracking data platform.
Download our free guides for golfers now!