In the recent update to the Shot Scope mobile app (June 2021) new graphs have been added to a few of the performance pages. This update is inline with the Strokes Gained Benchmarking recently released. To find out more about Shot Scope’s Strokes Gained Benchmarking click here.
This article will outline the new statistics, explain a little bit about them and how you can use them to help improve your game. The new statistics are within Approaches and Short Game are:
Green success by Distance/Lie type
Approach Proximity to hole by Distance/Lie Type
Short Game Proximity by Distance/Lie Type
Up & Down % based on Distance
To find out more about the other new performance statistics added, click here.
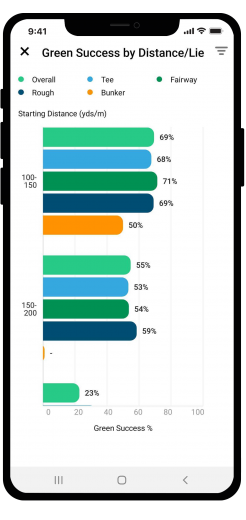
Green Success by Distance/Lie
This is a new graph added to the approach statistics. It contains a lot of useful information so make sure to have a careful look when analysing your approach play.
It is broken down into 4 mini graphs based on distance of approach shot (50-100y, 100-150y, 150-200y and 200+y). Scroll down to see more distances. Each bar represents a different lie type, which can be identified in the key at the top of the page.
This type of graph is useful to highlight if it is a certain distance that is your strength or weakness, or is it that your green hit % from the rough is hindering your game.
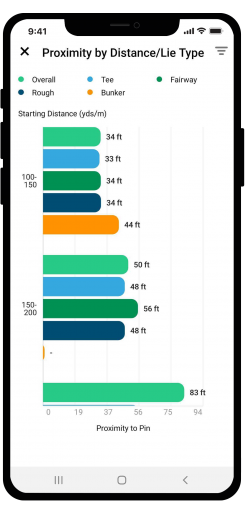
Approach Proximity by Distance/Lie
Similarly to the above statistic, this graph breaks down approach play proximity by distance and lie type. The same key and distance brackets are used.
This is helpful to see if there a specific distance or lie type that you struggle to hit it close from without categorising it as a green hit or not. If you can start hitting shots closer to the pin, naturally your score will also improve.
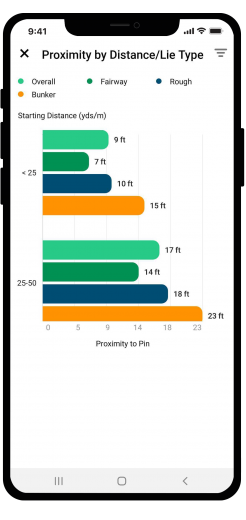
Short Game Proximity by Distance / Lie Type
This is a new graph added to the short game statistics.
It is broken down into 2 mini graphs based on distance of short game shot (<25 yards and 25-50 yards). Each bar represents a different lie type, which can be identified in the key at the top of the page.
Use this graph to pinpoint the distance and lie type you are good from, and also identify the areas that are not as good so that you can improve and sharpen up your short game.
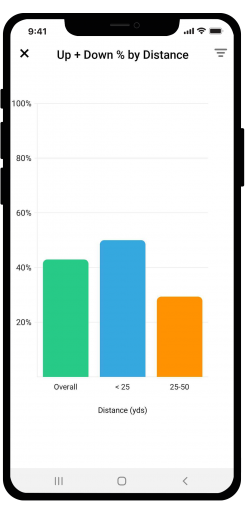
Up and Down % by Distance
This takes a look at the traditional up and down statistic but breaks it down into a little more detail.
For most golfers, you will probably see a higher up and down % from <25 yards versus 25-50 yards, as statistics tell us that the closer you are to the pin the closer you hit it. However you can use the previous graph to identify that for yourself.
Conclusion
Hopefully this article has helped explain some of the new statistics we have produced, and help you understand how you can use them to help your game.
If you haven’t already, we highly recommend downloading our free e-books, which take a much deeper dive into the statistics available on the Shot Scope platform and how you can use them to help you improve your game.
Did you know that 84% of missed putts over five feet finish short?
Or, that your typical drive is nearly 30 yards shorter than your Sunday best drive? These are just two intriguing statistics thrown up by Shot Scope’s performance tracking data platform.
Download our free guides for golfers now!